Objective
Test Results of the formation of ice on an uninsulated pipe carrying liquid nitrogen
Test Facility
A perspective view of the facility is shown in Figure 1. The test facility consists of a 36” long stainless steel pipe of 4 1/2” OD with 4” ID. The pipe ends are closed by 3/4” x 5 1/2” x 21” plates. The pipe is suspended from top using two pipe clamps.
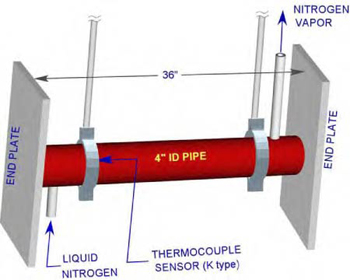
Figure 1: Perspective View of the test facility
To simulate cryogenic condition for an extended period of time, liquid nitrogen from a tank is supplied through a control valve into the pipe at one end and the nitrogen vapor is allowed to escape through a 1/2’’ tube from the other end.
The test facility is set in our workshop area where large size doors allow cross ventilation maintaining atmospheric conditions.
A type “K” thermocouple is set between the pipe and the clamp near the liquid nitrogen inlet to measure the pipe’s outer surface temperature history. Simultaneously, the ambient room temperature, relative humidity, and dew points were measured.
Test Procedure
Liquid nitrogen was allowed to fill completely the stainless steel pipe first, followed by a steady flow of liquid Nitrogen. By adjusting the control valve to a point when the liquid Nitrogen ceases to exit through the vertical outlet tube, the pipe remained completely full of liquid Nitrogen throughout the test. This flow process caused a small fraction of the flowing liquid nitrogen in the pipe to change phase to vapor by gaining latent heat of evaporation from the ambient air and exited through the outlet tube. This maintained almost a constant pipe surface temperature over an extended period of time.
Metering scales were fixed radially outward at three locations (near the two ends and at the middle) along the pipe to measure the ice deposition depth as a function of time.
Results
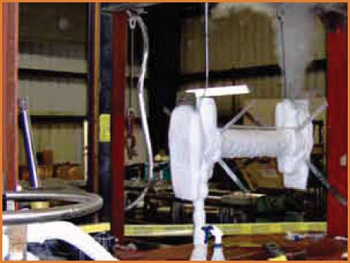
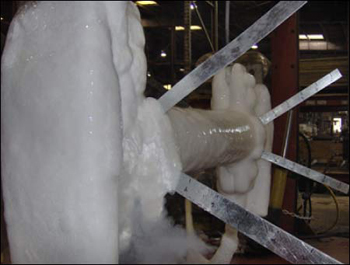
Test results are given in Table 1. After the liquid nitrogen flowed into the pipe, the atmospheric moisture started forming ice on the outer surface of the pipe, end plates and clamps. During this test, the ice thickness varied between day and night. This is due to the daytime temperature being higher than the nighttime temperature.
Material Items
| No. | Date | Time | Pipe Temp | Ambient Temp | Relative | |||
| Humidity | LHS | MID | RHS | |||||
| 1 | 9/14/2006 | 12:00 PM | 84oF | 83oF | 80% | 0 | 0 | 0 |
| 2 | 9/14/2006 | 2:00 PM | -30oF | 83oF | 80% | 0 | 0 | 0 |
| 3 | 9/14/2006 | 6:00 PM | -196oF | 91oF | 75% | 0.5 | 0.5 | 0.5 |
| 4 | 9/15/2006 | 6:00 AM | -299oF | 80oF | 62% | 1.5 | 1.5 | 1.5 |
| 5 | 9/15/2006 | 10:00 AM | -299oF | 80oF | 80% | 1.5 | 1.5 | 1.5 |
| 6 | 9/15/2006 | 2:00 PM | -289oF | 90oF | 50% | 1.25 | 1.25 | 1 |
| 7 | 9/15/2006 | 6:00 PM | -295oF | 93oF | 70% | 1.5 | 1.5 | 1.25 |
| 8 | 9/16/2006 | 6:00 AM | -296oF | 84oF | 80% | 2 | 2 | 1.75 |
| 9 | 9/16/2006 | 10:00 AM | -295oF | 88oF | 80% | 1.5 | 1.5 | 1.5 |
| 10 | 9/16/2006 | 2:00 PM | -294oF | 91oF | 80% | 1.25 | 1.5 | 1.5 |
The variations of ambient and pipes surface temperature with time are shown in Figure 2. In each plot, the day and night durations are shown by arrows. After filling up the pipe with liquid Nitrogen, the pipe’s surface temperature started falling exponentially with time and it took almost 20 hours to reach an almost steady state with small variations following a trend similar to that of the ambient temperature variations during day and night.
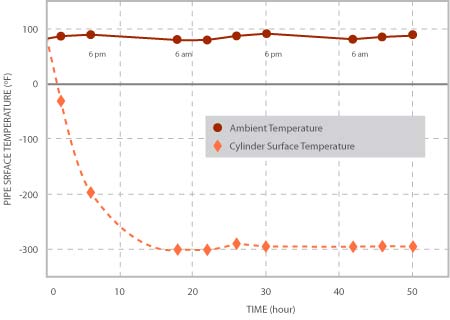
Figure 2, Variations of ambient and Pipe’s outer Surface Temperature with time.
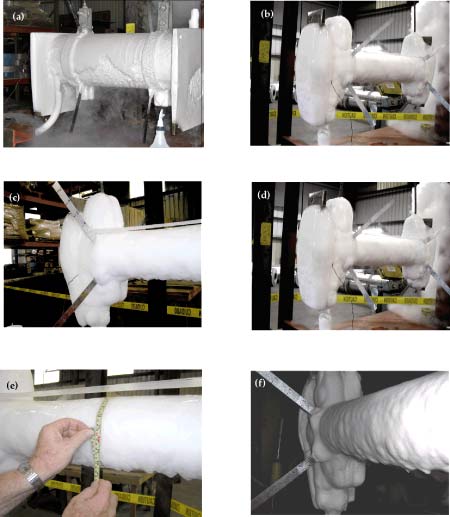
The variations of ice thickness with time at three axial locations of the pipe are shown in Figure 3. As it is to be expected, the rate of ice formation is higher at night (when the ambient temperature was 8 ~ 10 degrees lower than in the day time) than that during the day. From morning to early afternoon, as the ambient temperature increased, some ice melted, resulting in a decrease of the ice thickness. In the first night, the maximum thickness was about 1.5”; the average thickness decreased to about 1.25” during daytime while in the following night the average thickness increased to about 1.75” and decreased to 1.35” during the day time, when the test was stopped.
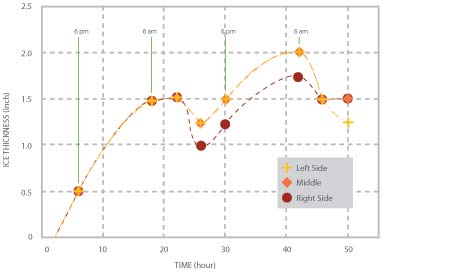
Figure 3, Variations of ice thickness at three locations with time
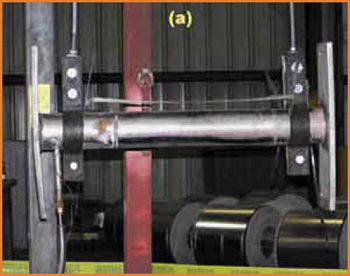
(a) Test facility without ice formation
