Objective
Testing the formation of ice on an uninsulated pipe carrying liquid nitrogen is performed to quantify how atmospheric moisture accumulates and freezes on extremely cold pipe surfaces, and to understand how this frost and ice growth changes with varying ambient conditions such as temperature, humidity, and airflow. Because ice formation can significantly increase weight, alter thermal behavior, and create safety or operational challenges, controlled testing provides real-world data on ice deposition rates, maximum thickness, and daily melt-freeze cycles. This information is essential for validating thermal models, determining whether insulation is needed, and ensuring that pipe supports, clamps, and surrounding structures are designed to handle the additional ice load safely and reliably.
Engineers use this information when designing LN₂ storage and transfer lines, food-processing cryogenic systems, aerospace test facilities, and semiconductor manufacturing systems, as the testing validates critical design factors such as material selection, support spacing, clamp and bracket designs, and operating procedures.
Test Facility
A perspective view of the apparatus is shown in Figure 1. The test configuration consists of a 36-inch-long stainless steel pipe with an outside diameter of 4½ inches and an inside diameter of 4 inches. The pipe ends are sealed with ¾-inch × 5½-inch × 21-inch plates, and the assembly is suspended from above using two pipe clamps.
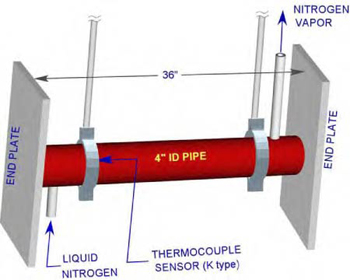
Figure 1: Perspective View of the test facility
To simulate cryogenic conditions for an extended period of time, liquid nitrogen from a tank is supplied through a control valve into the pipe at one end and the nitrogen vapor is allowed to escape through a 1/2’’ tube from the other end.
The test arrangement is set in our workshop area where large size doors allow cross ventilation maintaining atmospheric conditions.
A type “K” thermocouple is set between the pipe and the clamp near the liquid nitrogen inlet to measure the pipe’s outer surface temperature history. Simultaneously, the ambient room temperature, relative humidity, and dew points were measured.
Test Procedure
Liquid nitrogen was first allowed to completely fill the stainless steel pipe, after which a steady flow of liquid nitrogen was maintained. The control valve was adjusted such that liquid nitrogen ceased to discharge from the vertical outlet tube, thereby maintaining the pipe in a fully flooded condition for the duration of the test. Heat gain from the surrounding environment caused a small fraction of the liquid nitrogen to undergo phase change to vapor, which then vented through the outlet tube. This maintained almost a constant pipe surface temperature over an extended period of time.
Metering scales were fixed radially outward at three locations (near the two ends and at the middle) along the pipe to measure the ice deposition depth as a function of time.
Results
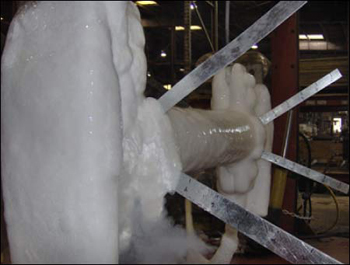
Test results are given in Table 1. After the liquid nitrogen flowed into the pipe, the atmospheric moisture started forming ice on the outer surface of the pipe, end plates and clamps. During this test, the ice thickness varied between day and night. This is due to the daytime temperature being higher than the nighttime temperature.
Material Items
| No. | Date | Time | Pipe Temp | Ambient Temp | Relative | |||
| Humidity | LHS | MID | RHS | |||||
| 1 | 9/14/2006 | 12:00 PM | 84oF | 83oF | 80% | 0 | 0 | 0 |
| 2 | 9/14/2006 | 2:00 PM | -30oF | 83oF | 80% | 0 | 0 | 0 |
| 3 | 9/14/2006 | 6:00 PM | -196oF | 91oF | 75% | 0.5 | 0.5 | 0.5 |
| 4 | 9/15/2006 | 6:00 AM | -299oF | 80oF | 62% | 1.5 | 1.5 | 1.5 |
| 5 | 9/15/2006 | 10:00 AM | -299oF | 80oF | 80% | 1.5 | 1.5 | 1.5 |
| 6 | 9/15/2006 | 2:00 PM | -289oF | 90oF | 50% | 1.25 | 1.25 | 1 |
| 7 | 9/15/2006 | 6:00 PM | -295oF | 93oF | 70% | 1.5 | 1.5 | 1.25 |
| 8 | 9/16/2006 | 6:00 AM | -296oF | 84oF | 80% | 2 | 2 | 1.75 |
| 9 | 9/16/2006 | 10:00 AM | -295oF | 88oF | 80% | 1.5 | 1.5 | 1.5 |
| 10 | 9/16/2006 | 2:00 PM | -294oF | 91oF | 80% | 1.25 | 1.5 | 1.5 |
The variations of ambient and pipe surface temperature with time are shown in Figure 2. In each plot, the day and night durations are shown by arrows. After filling up the pipe with liquid Nitrogen, the pipe’s surface temperature started falling exponentially with time and it took almost 20 hours to reach an almost steady state with small variations following a trend similar to that of the ambient temperature variations during day and night.
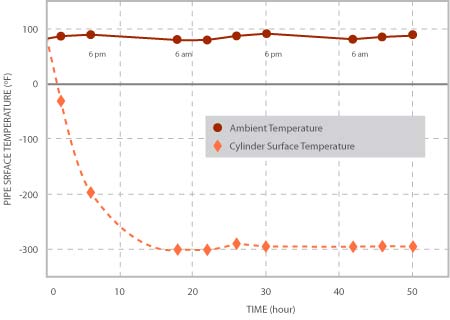
Figure 2, Variations of ambient and Pipe’s outer Surface Temperature with time.
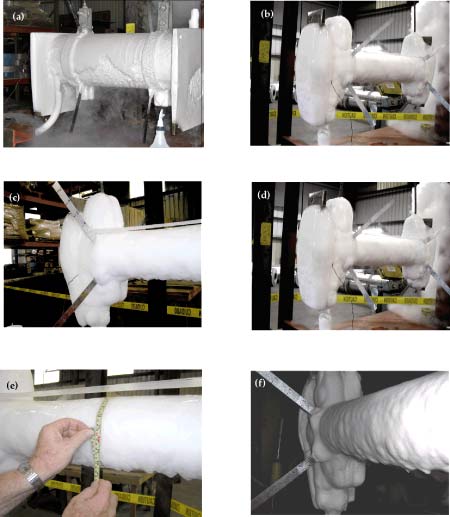
The variations of ice thickness with time at three axial locations of the pipe are shown in Figure 3. As it is to be expected, the rate of ice formation is higher at night (when the ambient temperature was 8 ~ 10 degrees lower than in the daytime) than that during the day. From morning to early afternoon, as the ambient temperature increased, some ice melted, resulting in a decrease of the ice thickness. In the first night, the maximum thickness was about 1.5”; the average thickness decreased to about 1.25” during daytime while the following night the average thickness increased to about 1.75” and decreased to 1.35” during the daytime, when the test was stopped.
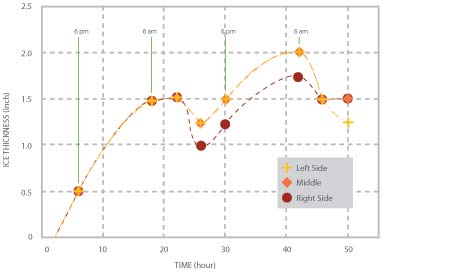
Figure 3, Variations of ice thickness at three locations with time
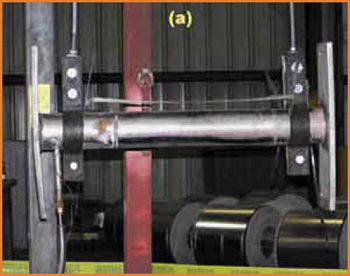
(a) Test facility without ice formation
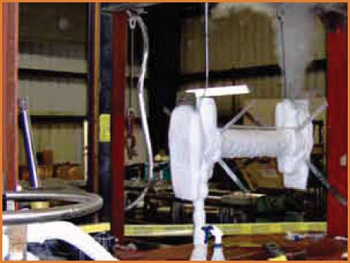
(b) Test facility with ice formation
The observed ice accumulation and temperature behavior during testing provide practical insight into how an uninsulated cryogenic pipe performs under real operating conditions. These findings guide engineers in evaluating structural capacity, thermal efficiency, operational needs, and overall system safety. The key engineering implications include:
-
- Structural Loading:
Ice buildup of up to ~2″ significantly increases the effective weight on the pipe, supports, clamps, and end plates. Support spacing, clamp strength, and structural members must be evaluated to ensure they safely accommodate worst-case ice loads.
- Structural Loading:
-
- Thermal Performance:
Ice formation indicates substantial heat transfer from ambient air to the cryogenic fluid. This can increase LN₂ consumption and may justify adding insulation to reduce boil-off, improve efficiency, and stabilize temperature conditions.
- Thermal Performance:
-
- Operational Reliability:
Daily thermal cycling causes ice to grow at night and partially melt during the day, which can lead to uneven loads, dripping water, and potential ice shedding.
- Operational Reliability:
-
- Safety Considerations:
Falling ice, slippery surfaces, and obscured instrumentation pose hazards in work areas. Appropriate shielding, signage, or insulation may be required to maintain a safe environment.
- Safety Considerations:
- Design and Maintenance Decisions:
The measured ice thickness trends help determine whether the line can remain uninsulated or if insulation is necessary to minimize frost, support longevity, and meet client or regulatory requirements.