Product: Transition Piece
Analysis Type: Finite Element Analysis (FEA)
Modeling Software: Parametric Technology Modeler (PTC)
FEA Software: COSMOS
Case Study Overview
This transition piece was modeled in accordance with the specifications provided in Drawing 6819001-159020. The design incorporates a standard flange at the top, as specified, and was modified to include additional pipe length while eliminating two flanges from the original configuration.
The rectangular flange is fabricated from 1.25 in × 5 in A36 steel flat bar. The transition piece and pipe sections are constructed from 3/8-inch-thick A516 Grade 70 steel, and these material properties were fully represented in the finite element model. The analysis assumed an operating temperature of 105°C (221°F).
Loading Conditions
Two pressure conditions were analyzed. All pressure values referenced below are expressed in PSIG (pounds per square inch gauge).
- Operating Condition (Internal Pressure): Internal pressure of 18.7 PSIG applied uniformly to all internal surfaces.
- Vacuum Condition (External Pressure):External pressure of 15 PSIG applied uniformly to all external surfaces (full vacuum condition).
Results Summary: The stress and displacement results for each loading condition are presented in the plots described below.
Internal Pressure Case: 18.7 PSIG
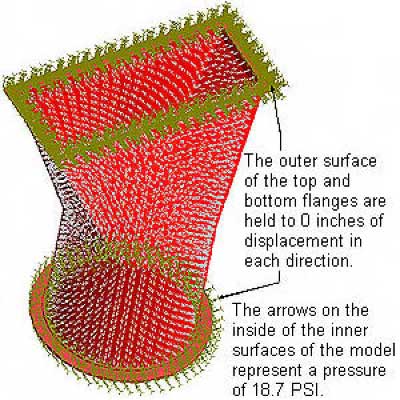
Illustration of Pressures and Displacements
This illustration shows the applied internal pressure and resulting deformation of the transition piece.
Stress Plot #1 – Internal Pressure
This plot displays the stress distribution throughout the model using a color-coded scale to indicate stress magnitude at each location.
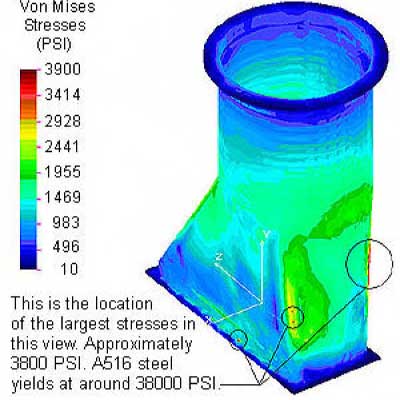
This model has an internal pressure of 18.7 PSI on every internal surface. The chart on the left of the model shows the stresses at every point in the model by a color coding system.
Stress Plot #2 –Internal Pressure
An additional view of stress distribution under the same internal pressure condition, highlighting localized stress concentrations.
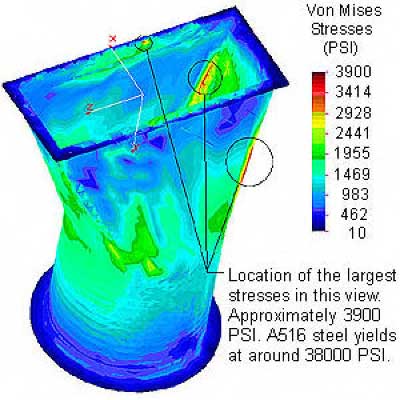
This model has an internal pressure of 18.7 PSI on every internal surface.
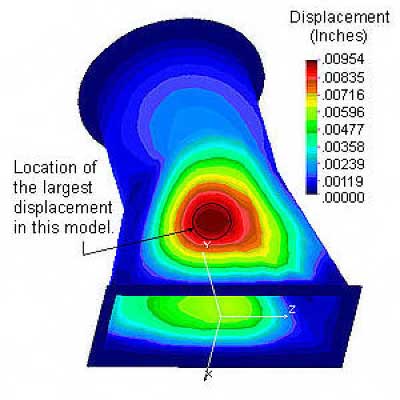
Displacement Plot #1 – Internal Pressure
This plot illustrates displacement across the model, with color contours representing displacement magnitude in inches.
This model has an internal pressure of 18.7 PSI on every internal surface. The chart shows the displacement at every point in the model by a color coding system which represents inches of displacement.
External Pressure Case: 15 PSIG
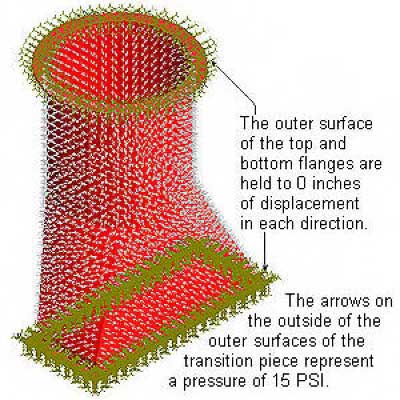
Illustration of Pressures and Displacements
This illustration shows the externally applied pressure and corresponding deformation of the transition piece.
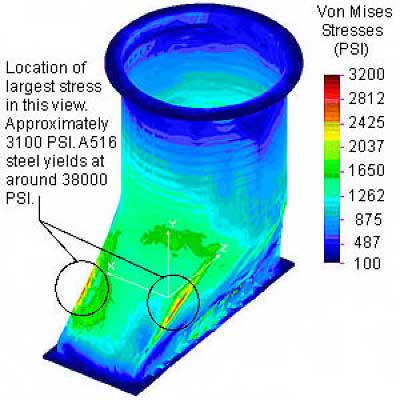
Stress Plot #1 – External Pressure
This plot presents the stress distribution resulting from uniform external pressure applied to all external surfaces.
This model has an external pressure of 15 PSI on every external surface. The chart above shows the stresses at every point in the model by a color coding system.
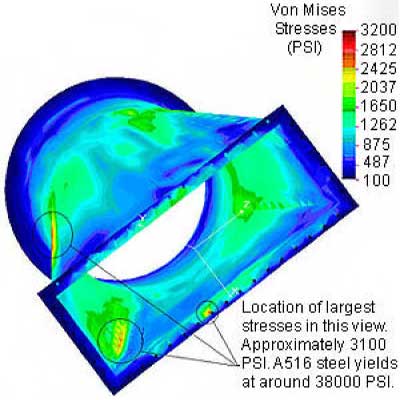
Stress Plot #2 – External Pressure
A secondary stress plot providing additional perspective on stress concentrations under vacuum conditions.
The chart above shows the stresses at every point in the model by a color coding system. This model has an external pressure of 15 PSI on every external surface.
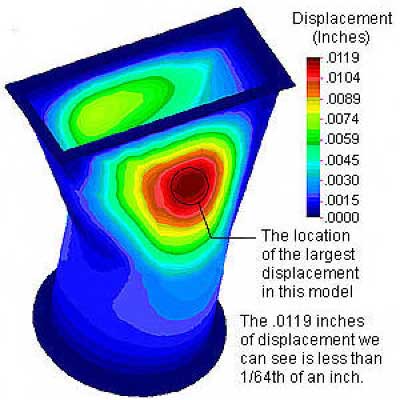
Displacement Plot #1 – External Pressure
This plot shows displacement magnitudes across the model under external pressure, expressed in inches using a color-coded scale.

The chart above shows the displacement at every point in the model by a color coding system which represents inches of displacement.
Notes
- All pressure values referenced in this analysis are PSIG (gauge pressure).
- Stress and displacement plots are used to evaluate structural performance and confirm design adequacy under both operating and vacuum conditions.